Correction appended August 30th. The prompt eval number below is wrong, and so is the conclusion I drew from it.
I upgraded the RAM on my HP desktop on August 9th. 8GB -> 32GB.
The reason was gemma4:26b-a4b-it-qat. Twenty-six billion parameters, quantized, but it still won’t fit in 8GB without constant swapping. The box had been running smaller background jobs with a RAM threshold gate, a floor of 900MB free to ensure Ollama had room to work. A 26B model changes the math.
With 32GB, the model loads and stays resident. About 10.6GB free with it warm and my Home Assistant VM running alongside. The upgrade also surfaced something I hadn’t thought about. The old idle gate floor was set to 900MB, which had made sense when the box had 8GB but was now stale by a factor of four. I reset it to 4GB and updated the scripts. The background jobs that use HP’s local Ollama picked up from there. The log digest runs daily at 6:10 AM; the board grooming script calls over Tailscale from EC2 every couple hours.
It works. And then I ran a benchmark.
Generation speed on gemma4:26b-a4b-it-qat on this box is about 10 tokens per second. Prompt eval runs around 108 tok/s. But generation is the number that matters when something is waiting on a response. Ten tok/s means a 200-token answer takes twenty seconds. A 500-token response is nearly a minute.
The box has an Intel i7-8700 and Intel UHD 630 integrated graphics. No discrete GPU. Inference is CPU-bound. That’s what 10 tok/s looks like on a 2017 i7 with no accelerator.
For batch jobs, fine. The log digest doesn’t need to summarize an anomaly log quickly. The board groomer isn’t time-sensitive. The speed works for the workload the setup was built for.
Where it doesn’t work is anything interactive. An agentic loop where the next call waits on the current response needs faster generation than this. Ten tok/s is too slow to think out loud. For that kind of work, the box needs a GPU. That’s a different upgrade.
Not yet where I want to be with my local LLM setup, but I’m closer :)
Update, August 30th.
Two things in this post were wrong, and one of them took the conclusion with it.
That 108 tok/s prompt eval figure isn’t gemma4’s. I re-measured on the same box eighteen days later and got 28. It turns out 108 is almost exactly what qwen3:0.6b does. I got 111 off it when I checked. That’s the little model my log digest actually calls, so I’d benchmarked one and filed the number under the other.
Dumb enough on its own. The worse part is the sentence right after it, where I said generation is the number that matters when something is waiting on a response.
For the work this box actually does, it isn’t.
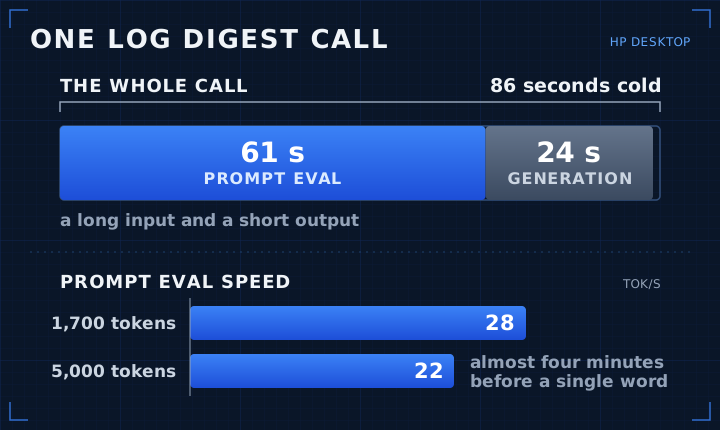
A log digest is a long input and a short output. I hand it forty lines of anomalies and ask for a few bullets back. When I timed the real thing instead of a toy prompt, the whole call took 86 seconds cold, and 61 of those were prompt eval. Generation was 24. The half I’d waved off was doing most of the work.
I also assumed prompt eval would get better with longer prompts, the way batching usually pays you back for feeding it more. It goes the other way. 28 tok/s at 1,700 tokens, 22 at 5,000. A 5,000 token prompt sits there for almost four minutes before the model writes a single word.
Generation is still around 8 tok/s, close enough to the 10 I claimed. The RAM fit was half the problem, and I got that part right. I just spent two and a half weeks confident about the other half while timing the wrong end of the request.
I’ve since re-run it against a real digest prompt and put the actual numbers somewhere I’ll find them again, which is more than I did the first time.